 |
CCCESD/CDDGC
Council of Chairs of Canadian Earth Science Departments
|
 |
|
|
CCCESD/CDDGC
Council of Chairs of Canadian Earth Science Departments
|
|
Posted are data for the years 2002 to 2005. An initial attempt was made by Greg Finn to collect 2002 data, and remaining data from 2002, and 2003 to 2005 were obtained by Rob Raeside through the course of the 2005/06 academic year. Understandably, having to dig through older records, some data are difficult to obtain. However, most departments were able to complete the surveys although some were unable to determine the male/female split. Male/female data are therefore not reported here. Data are quite complete. All schools responded for some part of this time frame as shown on the page listing responses, and extrapolation has been limited to 4 schools only.
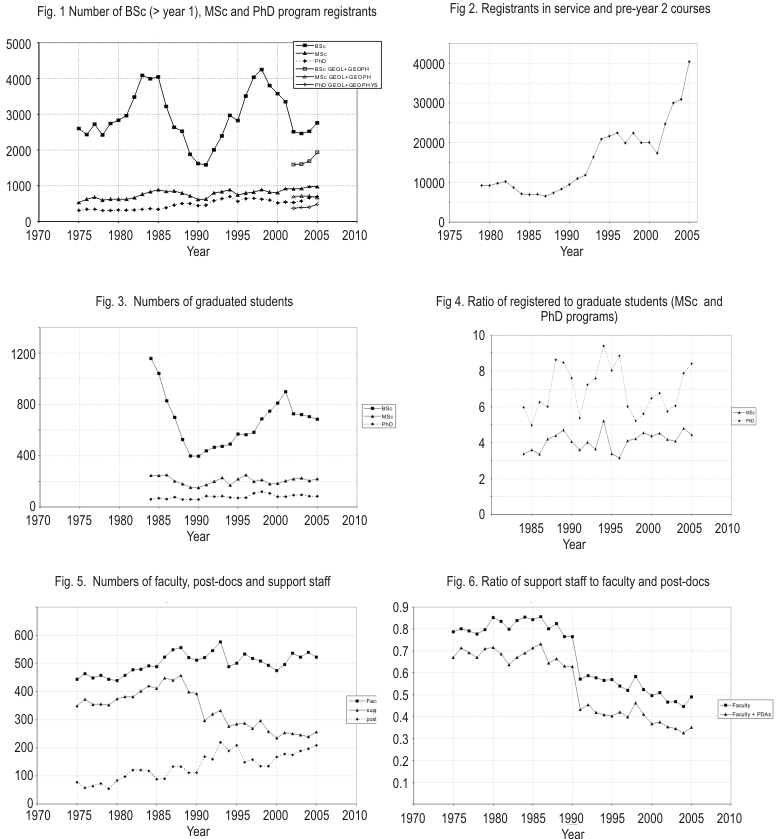
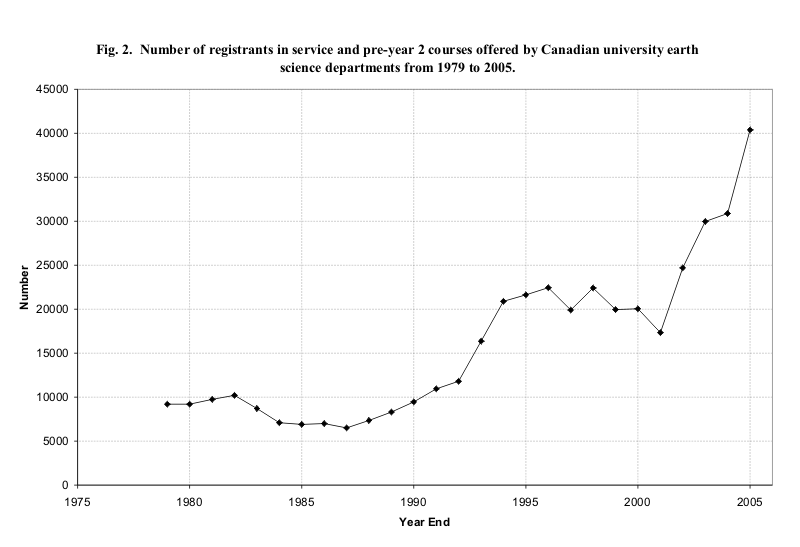
Figure 1 shows total undergraduate and graduate student enrolment. The downward trend in undergraduate program registrations from 1998-2003 appears to have bottomed out at about 60% of the peak values in the late 90's and has increased slightly since 2003, mainly as a result of increased enrolment in Ontario and the West. Quebec has seen a decline in undergraduate enrolments since 2003. Considering only Geology/Earth Science majors (i.e. excluding Env. Science, Atm. Science, Geophysics, etc.) the enrolment in undergraduate programs has increased significantly in 2004 and 2005 (5% and 15% respectively). The 1990-2001 upward trend in BSc graduations appears to have dropped to about the 1998 level, and stayed constant. Shown with unfilled symbols are the numbers of students in Geology and/or Geophysics only (i.e., excluding students enrolled in environmental science, physical geography, oceanography, atmospheric science, or "other" subjects).
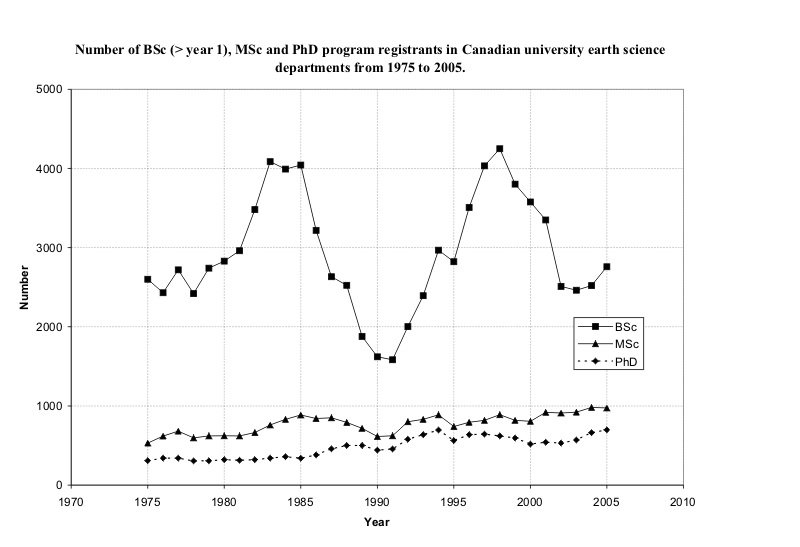
Numbers of first year and service course registrations, Figure 2 are increasing very rapidly again after a decade in the 20,000 range. This increase is most dramatic in Ontario in 2005, with a 66% increase in one year. This presumably represents the bulge from the double entry cohort in 2003 now seeking elective courses in science to complete degree programs.
The number of registrations for graduate work (Figure 1) is rising modestly. Of note is the 33% growth in PhD registrations from 2002-2005, although graduations don't show any change (Figure 3). There is no obvious correlation between enrolment in undergraduate programs and MSc or PhD registrations.
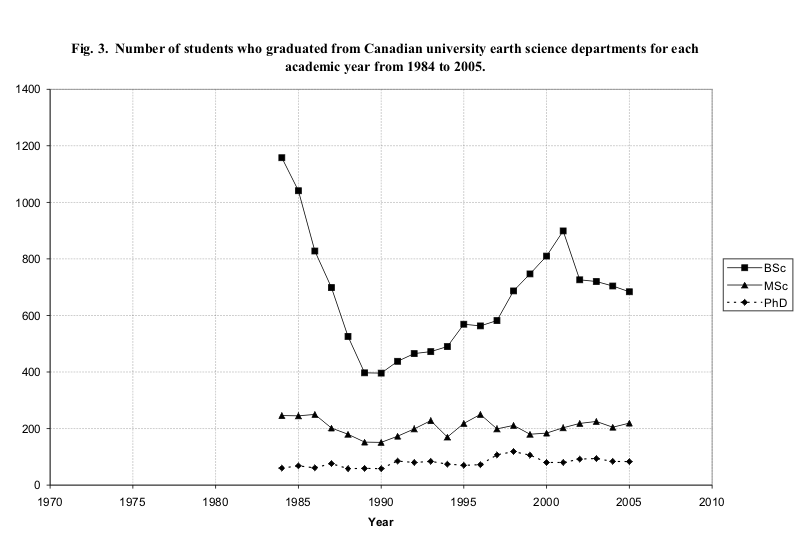
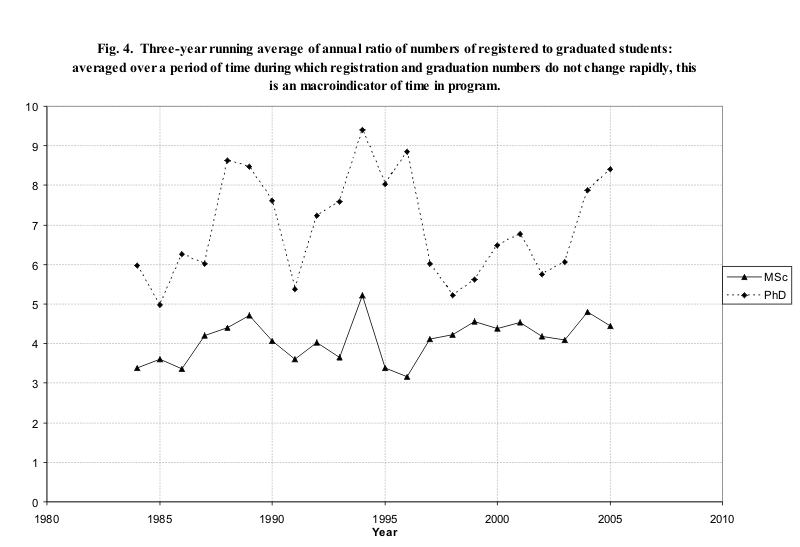
Figure 4 presents an analysis of the three-year running average of the ratios of numbers of students registered in MSc and PhD programs to the numbers of students graduating. Over a period of time during which registration and graduation numbers do not change rapidly, this is a macroindicator of time in program. It must be noted that students who drop out of program will skew the values toward higher numbers. Of note in the past decade is an increase in "time in program" for PhD students, but this may be due to the recent increase in new enrolments in PhD programs described above.
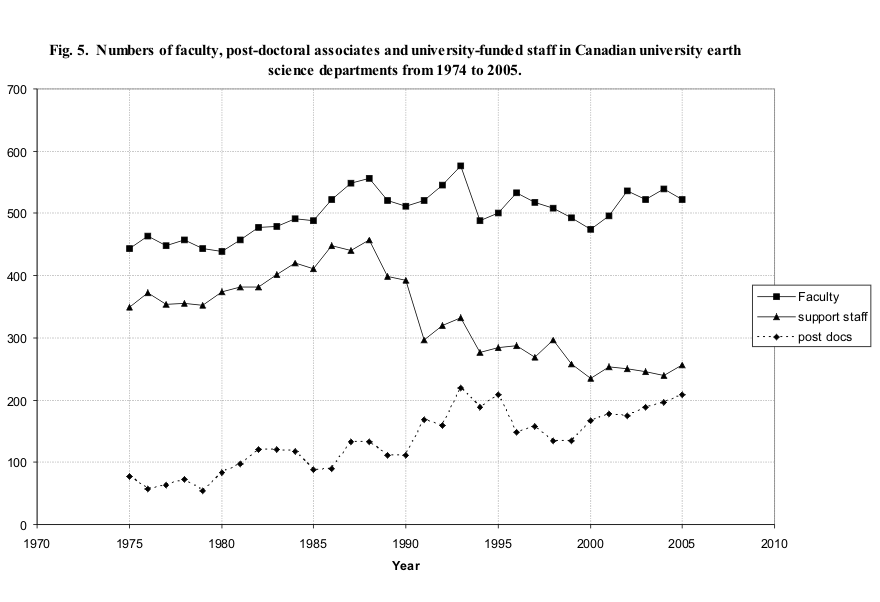
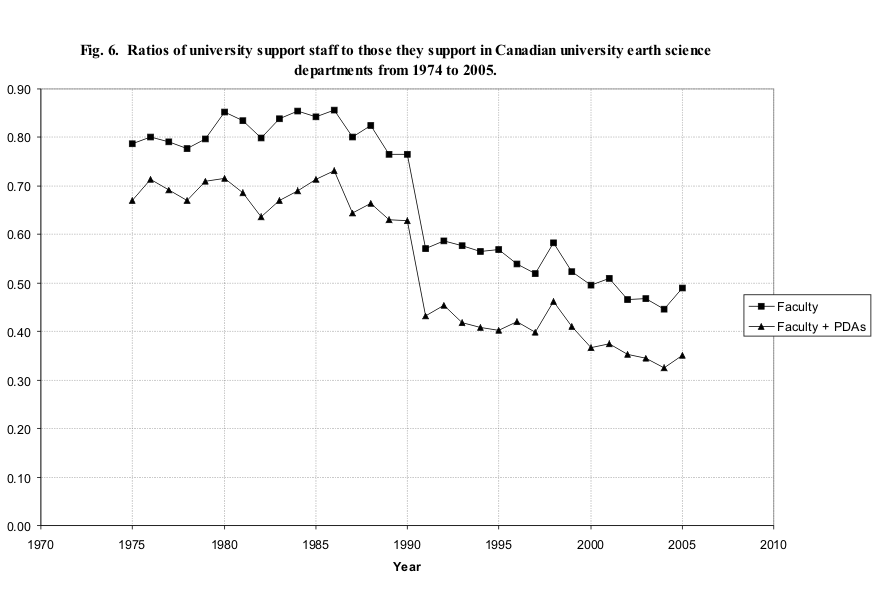
Numbers of faculty, Post-Doctoral Associates/Fellows, and support staff are shown on Figure 5. Faculty numbers are level over the past 4 years, after a 10% climb from 2000 to 2002 which might have been the result of CRC appointments. If so, more recent appointments have been balanced by losses elsewhere. The steady decline of support staff from 1988 to 2000 appears to have levelled off, while the number of post doctoral assistants is showing a steady rise with a 60% increase since 1998. The ratio of support staff to faculty continued a steady decline to 2004, but has rebounded in 2005 as a result of appointments of technicians in Ontario and the West.
Regional analysis by year: